If you’ve ever needed to dynamically create an Excel file from data in Power Automate — maybe from a Copilot Studio agent, a SharePoint list, or an API response — you’ve probably realised there’s more than one way to skin this particular cat. In this post, I’m going to walk you through three different approaches to generating and populating an Excel file, each with its own strengths and trade-offs. I’ll be using a sample F1 2026 driver grid as my data, but this could just as easily be data passed from a Copilot Studio Agent, a Dataverse table, or any other source.
The Sample Data — The 2026 F1 Grid
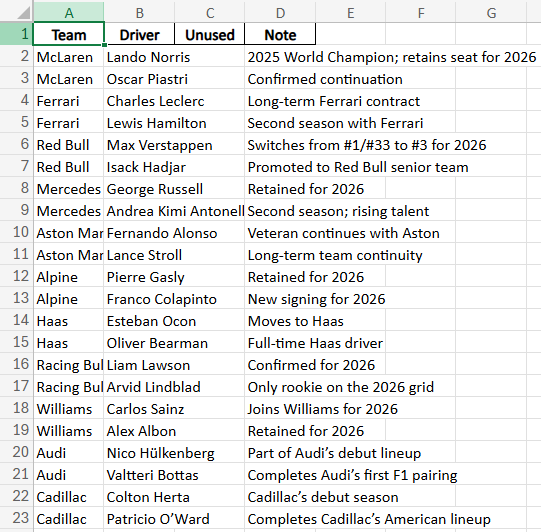
Before we dive into the methods, let’s talk about the data. I’m using a Compose action to define a JSON array of the 2026 F1 driver lineup — 22 drivers across 11 teams, including the new Cadillac entry. Each object has a team, driver, driverNumber, and notes field.
[
  { "team": "McLaren", "driver": "Lando Norris", "driverNumber": 1, "notes": "2025 World Champion; retains seat for 2026" },
  { "team": "McLaren", "driver": "Oscar Piastri", "driverNumber": 81, "notes": "Confirmed continuation" },
  { "team": "Ferrari", "driver": "Charles Leclerc", "driverNumber": 16, "notes": "Long-term Ferrari contract" },
  ...
]
In a real-world scenario, this JSON could come from a Copilot Studio agent topic that passes structured data to a Power Automate cloud flow, or from a connector pulling data from Dataverse, SharePoint, SQL Server, or an API.
After the Compose, I use a Select action to transform the array of objects into a 2D array (array of arrays) — this is the format that several Excel actions and Office Scripts expect when writing data in bulk.
Why the Select Action? Objects vs Arrays
Here’s the thing — Power Automate and Office Scripts can’t just take a JSON object like { "team": "McLaren", "driver": "Lando Norris" } and write it straight into an Excel range. The setValues() method in Office Scripts (and similar bulk-write operations) expects a 2D array — an array of arrays where each inner array represents a row of cell values, with no property names attached.
So the Select action’s job is to strip out the keys and return just the values in the right order. I switch the Select into text mode (click the little toggle icon on the right of the Map field) and use this expression:
createArray(item()?['team'], item()?['driver'], string(item()?['driverNumber']), item()?['notes'])
This takes each object in the array and maps it to a simple array of values:
// Before (array of objects from Compose):
{ "team": "McLaren", "driver": "Lando Norris", "driverNumber": 1, "notes": "2025 World Champion..." }

// After (array of values from Select):
["McLaren", "Lando Norris", "1", "2025 World Champion..."]
Notice the string() wrapper around driverNumber — that’s important because createArray() works best when all values are the same type, and Excel’s setValues() expects a string[][]. Without it, you might get type mismatch errors.
The end result is a clean 2D array that any of the three methods below can consume directly — no further transformation needed.
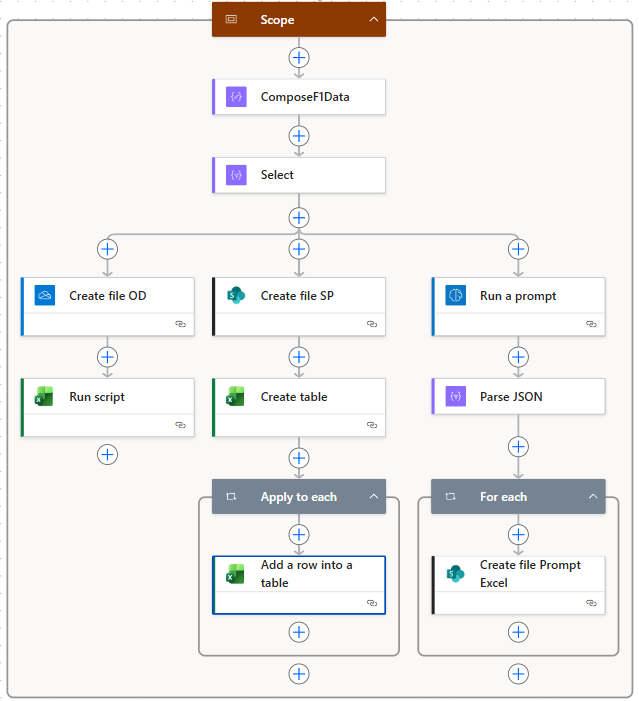
The Flow Overview
The beauty of this flow is that all three methods run in parallel after the Select action. Each branch creates an Excel file and populates it differently, so you can compare the approaches side by side.
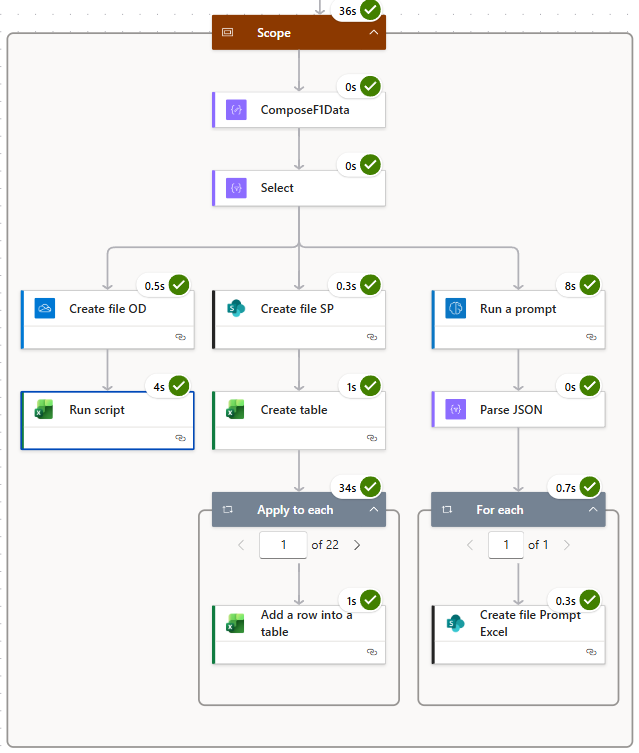
Here’s the completed run — the whole scope takes about 36 seconds, with the old-school method being the slowest at 34 seconds due to its row-by-row looping:
Method 1: Office Scripts — The Pro-Code Powerhouse
This is my favourite approach and the one I’d recommend for most scenarios. It uses Office Scripts — TypeScript-based scripts that run inside Excel Online — called directly from Power Automate via the Run script action.
How It Works
- Create file OD — Create a blank
.xlsxfile on OneDrive for Business (just a space character as the body — enough to generate a valid but empty workbook). - Run script — Call an Office Script that takes the 2D data array and does everything: creates a worksheet, writes the data, formats it as a table, auto-fits columns, and applies a table style.
The Office Script
Here’s the full script I’m using. It’s designed to be reusable — you pass in parameters from Power Automate and it handles the rest:
function main(
    workbook: ExcelScript.Workbook,
    data: string[][],
    sheetName?: string,
    createTable?: boolean,
    hasHeaders?: boolean,
    autoFitColumns?: boolean,
    tableName?: string,
    tableStyle?: string
): CreateWorksheetResult {

    // Validate input
    if (!data || data.length === 0) {
        throw new Error("Data array is empty or missing.");
    }

    // Apply defaults
    const resolvedSheetName = sheetName || "Sheet";
    const resolvedCreateTable = createTable ?? false;
    const resolvedHasHeaders = hasHeaders ?? true;
    const resolvedAutoFit = autoFitColumns ?? true;
    const resolvedTableStyle = resolveTableStyle(tableStyle);

    // Create the worksheet (handles duplicate names)
    const finalSheetName = getUniqueSheetName(workbook, resolvedSheetName);
    const newSheet = workbook.addWorksheet(finalSheetName);

    // Determine dimensions and normalise jagged arrays
    const rowCount = data.length;
    const colCount = Math.max(...data.map(row => row.length));
    const normalisedData = data.map(row => {
        const padded = [...row];
        while (padded.length < colCount) padded.push("");
        return padded;
    });

    // Write data starting at A1
    const startCell = newSheet.getRange("A1");
    const dataRange = startCell.getResizedRange(rowCount - 1, colCount - 1);
    dataRange.setValues(normalisedData);

    // Optionally create a table
    let createdTableName: string | undefined;
    if (resolvedCreateTable) {
        const resolvedTableName = tableName || generateTableName(finalSheetName);
        const table = newSheet.addTable(dataRange, resolvedHasHeaders);
        table.setName(resolvedTableName);
        table.setPredefinedTableStyle(resolvedTableStyle);
        createdTableName = table.getName();
    }

    // Optionally auto-fit columns
    if (resolvedAutoFit) {
        const usedRange = newSheet.getUsedRange();
        if (usedRange) usedRange.getFormat().autofitColumns();
    }

    newSheet.activate();

    return {
        sheetName: finalSheetName,
        tableName: createdTableName || "",
        rowCount: rowCount,
        columnCount: colCount
    };
}
The script also includes helper functions for generating unique sheet names, resolving table style keywords ("light", "medium", "dark") to actual Excel style names, and sanitising table names.
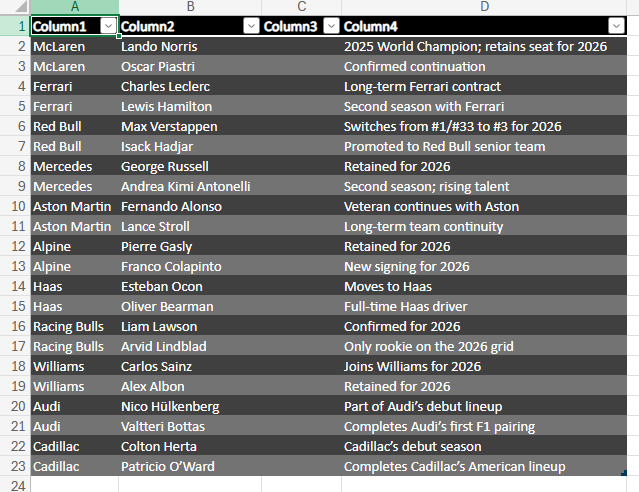
The Result
Because I passed hasHeaders: false and tableStyle: "dark" in this demo, the output gets auto-generated column headers (Column1, Column2, etc.) with a dark table style. In practice, you’d either set hasHeaders: true and include a header row in your data array, or add headers as a separate parameter.
The Real Power — Any Shape, Any Size
Here’s the thing that makes this approach stand out: the script doesn’t care about your data shape. Whether you’re passing 4 columns or 40, 10 rows or 10,000 — the script dynamically determines the number of rows and columns from the 2D array you feed it. You don’t need to pre-define column names, hard-code ranges, or update the script when your data structure changes. It calculates dimensions with data.length and Math.max(...data.map(row => row.length)), normalises any jagged rows, and writes everything in a single setValues() call. Swap out F1 drivers for invoice data or customer records tomorrow — the exact same script just works.
I’ve covered Office Scripts with Power Automate before, but back then writing a solid script required a reasonable comfort level with TypeScript. That barrier has essentially vanished now — with Copilot and LLMs, you can describe what you want in plain English and get a well-structured, efficient script back in seconds. You don’t need to be a developer to take advantage of this approach anymore.
Why I Like This Approach
- Blazing fast — writes all data in a single operation (4 seconds for 22 rows)
- Shape-agnostic — handles any number of rows and columns automatically, no schema changes needed
- Highly configurable — table styles, sheet names, auto-fit, headers, all parameterised
- No looping — unlike Apply to Each, this writes everything in one go
- Reusable — save the script once, call it from any flow
- Returns metadata — the script returns sheet name, table name, row count, and column count for downstream actions
Method 2: The Old-School Create Table & Add Rows
This is the approach most Power Automate tutorials will show you, and it works — but it has some significant performance limitations. I’m calling it “old-school” because it’s been around since the early days of Power Automate.
How It Works
- Create file SP — Create a blank
.xlsxfile on SharePoint (again, just a space character as the body). - Create table — Use the Excel Online Create table action to define a table with named columns (
Team, Driver, DriverNumber, Notes) at rangeA1:B1. - Apply to each — Loop through every item in the original Compose data and use Add a row into a table to insert each row one at a time.
The Add Row Trick — Dynamic Files Need an Object
Here’s an important tip that catches a lot of people out. Because the file is dynamically created (its name is a GUID), the Add a row into a table action can’t look up the table schema at design time. Normally, when you point this action at a known file and table, Power Automate automatically shows you a nice form with the column names as fields. With a dynamic file reference, it has no idea what columns exist — so you get nothing.
The workaround? Switch the Add a row input to a JSON object where the keys match your table’s column names. For each item in the loop, you build it like this:
{
  "Team": "@item()?['team']",
  "Driver": "@item()?['driver']",
  "DriverNumber": "@item()?['driverNumber']",
  "Notes": "@item()?['notes']"
}
The column names in your JSON must match exactly what you defined in the Create Table action. If you called the column DriverNumber in Create Table, you need "DriverNumber" as the key — not "Driver Number" or "driverNumber". This is where you become the schema mapper, and it’s something the designer can’t auto-populate for you when the file path is dynamic.
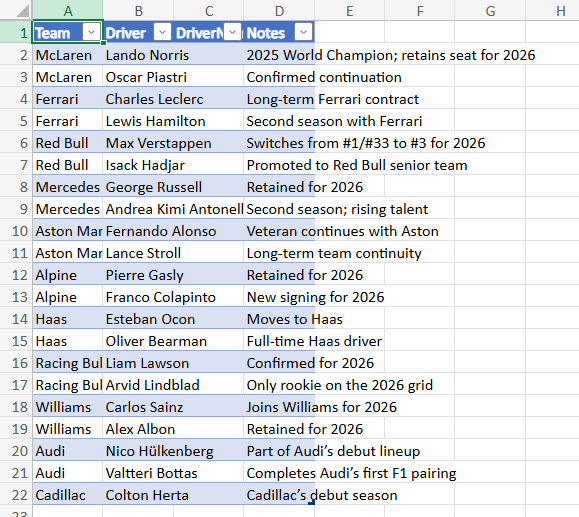
The Result
This produces a clean table with proper column headers — the headers come from the Create Table action, not from the data itself.
The Downsides
- Slow — 34 seconds for 22 rows because it makes a separate API call for every single row. Imagine doing this with 500 or 1,000 rows.
- API throttling risk — all those individual calls can hit connector rate limits.
- More actions to maintain — you need to map every column in the Add Row action, and if your schema changes, you’re updating it in multiple places.
- Dynamic file gotcha — as described above, you lose the designer’s auto-populated fields and must manually construct the row object.
That said, this method requires zero code and is the most accessible for citizen developers who aren’t comfortable with Office Scripts or AI Builder.
Method 3: AI Builder with Code Interpreter
This is the most exciting and arguably the most “magical” approach. It uses AI Builder’s Code Interpreter (via a custom prompt) to generate an Excel file directly from the data.
How It Works
- Run a prompt — Call an AI Builder custom prompt that takes the F1 data and instructs the AI to generate an Excel file using Code Interpreter. The AI writes Python code behind the scenes to create the workbook.
- Parse JSON — Parse the response from AI Builder, which includes the generated file as base64-encoded content.
- For each — Loop through the returned files (usually just one) and use a Create file action to save the base64 content as an
.xlsxfile on SharePoint.
The Result
The AI interprets your data and creates the Excel file autonomously — handling the table formatting, column layout, and data population in a single operation. The quality of the output depends heavily on the data and prompt you provide, so it’s worth being specific about column names and formatting expectations.
Pros and Cons
Pros:
- Incredibly flexible — the AI can format, style, add formulas, create charts, and do things that would take dozens of flow actions
- No schema mapping — just pass the data and describe what you want
- Single operation — no looping required
Cons:
- AI Builder credits — this consumes AI Builder or Copilot credits
- Slightly slower — 8 seconds isn’t bad, but it’s more than Office Scripts
- Black box — harder to debug when something goes wrong
Comparing the Three Approaches
| Aspect | Office Scripts | Old-School (Add Rows) | AI Builder Code Interpreter |
|---|---|---|---|
| Speed (22 rows) | ~4 seconds | ~34 seconds | ~8 seconds |
| Scalability | Excellent | Poor | Good |
| Code required? | Yes (TypeScript) | No | No (prompt only) |
| Column headers | Configurable | Defined in Create Table | AI-determined |
| Formatting control | Full | Limited | Prompt-dependent |
| Cost | Included | Included | AI Builder credits |
| Best for | Pro-code devs, bulk data | Simple/small datasets | Creative formatting, ad-hoc reports |
Honourable Mention — The Graph API
There’s actually a 4th option I didn’t demo in this video: using the Microsoft Graph API to create and populate Excel files via HTTP actions. Graph gives you a similar level of flexibility to Office Scripts — you can create workbooks, add worksheets, write data in bulk, create tables, and format cells — all through REST API calls. The catch? It’s significantly trickier to implement. You’re dealing with authentication, constructing JSON payloads for each API call, managing session IDs, and handling pagination for large datasets. It’s powerful, but it’s a lot more plumbing. I’ve covered the Graph API approach to Excel in a previous video if you want to explore it — just be prepared to roll your sleeves up.
Calling from a Copilot Studio Agent
All three methods work perfectly when triggered from a Copilot Studio Agent. The pattern is straightforward:
- Your Copilot Studio topic collects or generates structured data (from user input, Dataverse queries, API calls, etc.)
- The topic calls a Power Automate cloud flow using the “Call a flow” action
- The flow receives the data as JSON input and uses any of the three methods above to generate the Excel file
- The flow returns the file link (or file content) back to the agent, which can present it to the user
This is a powerful pattern for building agents that can generate reports, export data, or create formatted documents on demand — all through a natural conversation.
Practical Takeaways
- For performance-critical scenarios, go with Office Scripts. The upfront investment in writing the script pays off immediately — it’s fast, reusable, and gives you complete control.
- For quick and simple needs, the old-school method still works fine for small datasets. Just be aware of the performance cliff with larger volumes.
- For creative or ad-hoc reporting, AI Builder with Code Interpreter is genuinely impressive — but keep your prompts specific if you want predictable output, and watch your credit consumption.
- Whichever method you choose, wrapping it in a Power Automate flow means it can be called from Copilot Studio, Power Apps, another flow, or even an HTTP trigger — making it a versatile building block in your automation toolkit.
Final Thoughts
There’s no single “right” way to generate Excel files in Power Automate — it depends on your scenario, your skill set, and your requirements. What I love about the Power Platform is that it gives you options ranging from zero-code (Create Table + Add Rows) to low-code with AI (AI Builder) to pro-code (Office Scripts) — all within the same ecosystem. The fact that any of these can be triggered from a Copilot Studio agent makes them even more powerful, turning a simple chat interaction into a fully formatted Excel report.
If you found this useful, check out my YouTube channel DamoBird365 for more Power Platform tips, tutorials, and automation ideas!